
The articles in this overview, including their headlines, are direct excerpts from the original sources. The charts and tables have been produced by Finanssitaito based on data from the original sources. For publications in other languages, the translation is Finanssitaito’s own, and the original source is not responsible for it.
1. ECB: Survey on the Access to Finance of Enterprises (Q3/2026): Lending Conditions Tightened
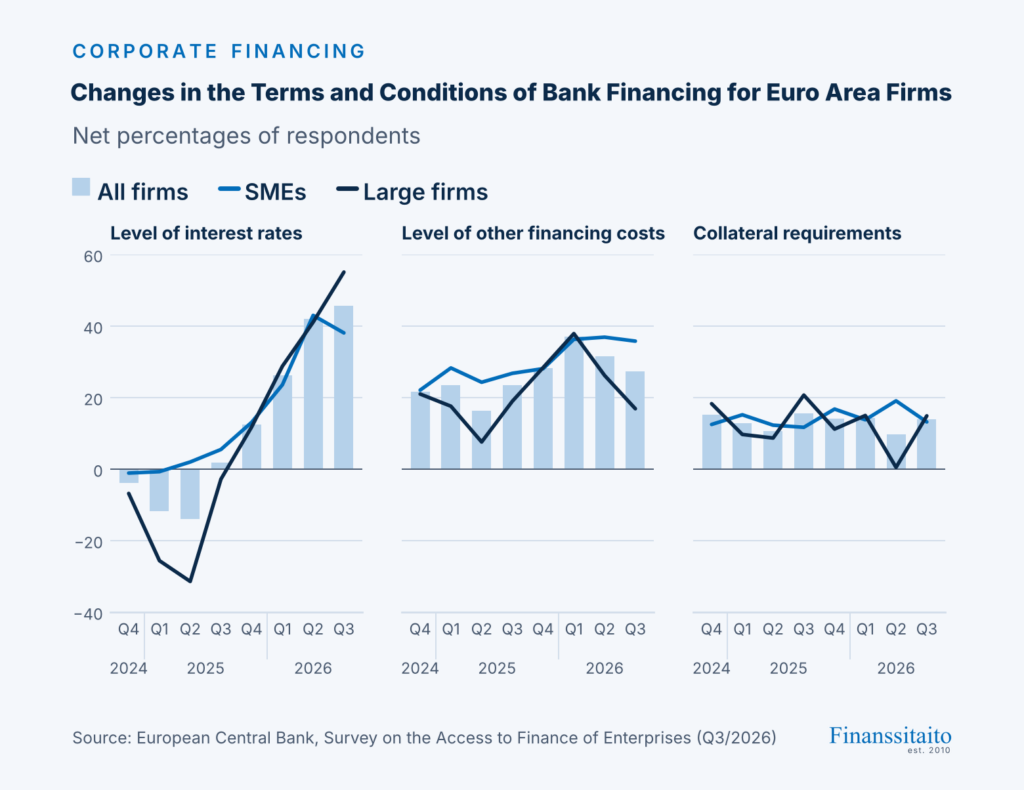
Firms reported a further net tightening of bank loan interest rates and other loan conditions related to price and non-price factors. Large firms reported increases more often (net 55%, up from 41%) than small and medium-sized enterprises (SMEs) (net 38%, down from 43%). At the same time, a net 27% of firms reported increases in other financing costs, and a net 14% reported increases in collateral requirements.
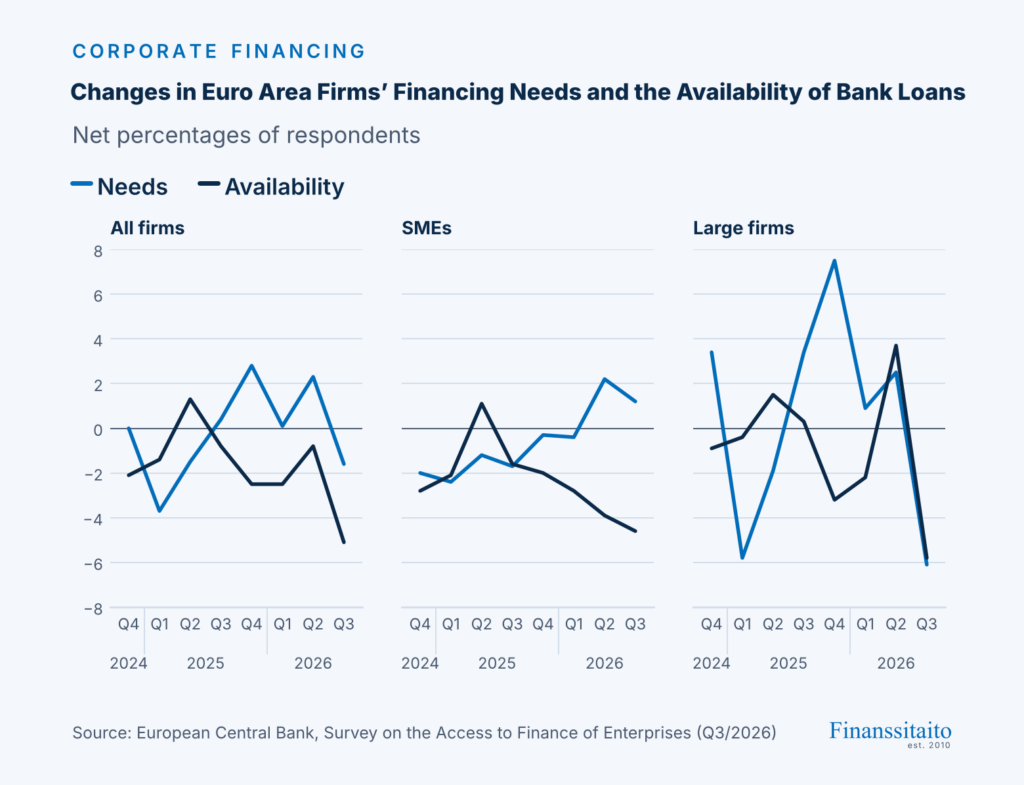
Bank loan availability declined by more than financing needs, widening the financing gap. Firms reported a decrease in the availability of bank loans in the third quarter of 2026 (−5%, compared with a net −1% in the second quarter of 2026), with both SMEs and large firms reporting lower availability.
Survey on the Access to Finance of Enterprises: lending conditions tightened | European Central Bank
2. ECB: October 2026 Euro Area Bank Lending Survey
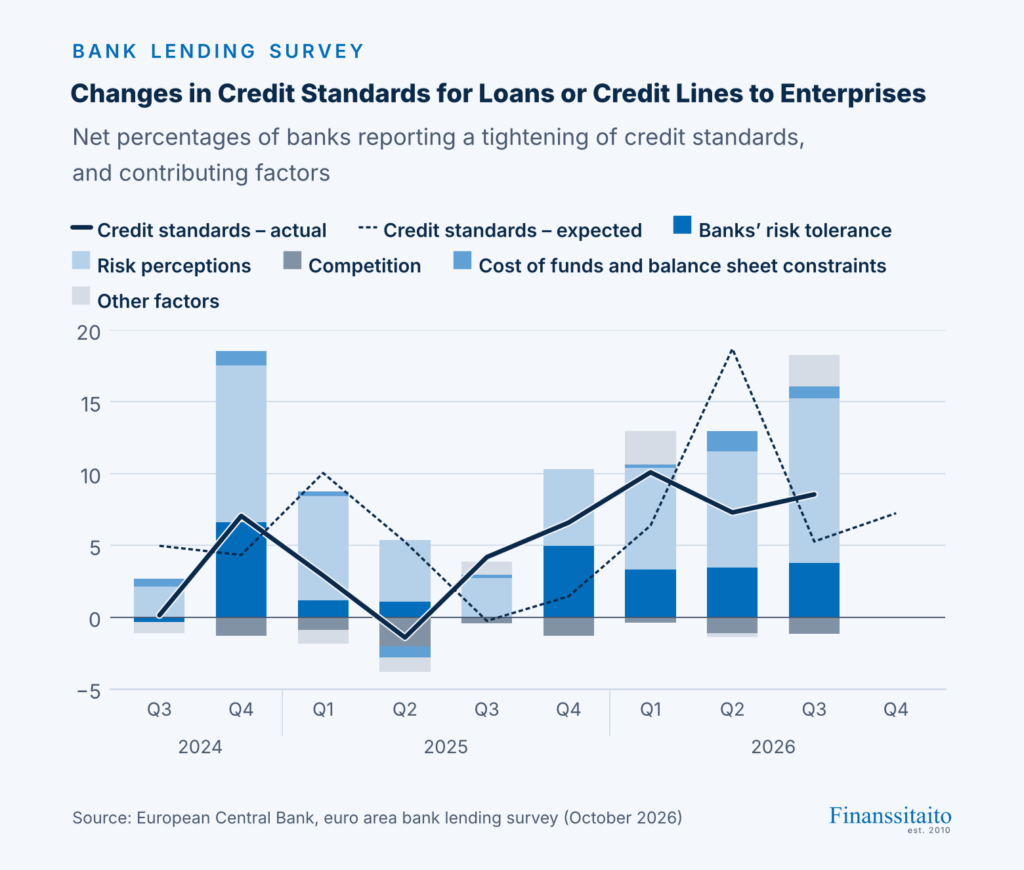
According to the October 2026 bank lending survey, euro area banks reported a further net tightening of credit standards – banks’ internal guidelines or loan approval criteria – for loans or credit lines to enterprises in the third quarter of 2026 (net percentage of 9% of banks). Banks reported unchanged credit standards for loans to households for house purchase and a further net tightening for consumer credit and other lending to households. For firms, the net tightening surpassed the expectations reported by banks in the previous survey round (5%).
In the third quarter of 2026, euro area banks reported a net decrease in demand for loans or credit to firms (net percentage of −6%). Weaker demand for fixed investment among small and medium-sized enterprises and the move towards alternative sources of finance also weighed slightly on loan demand.
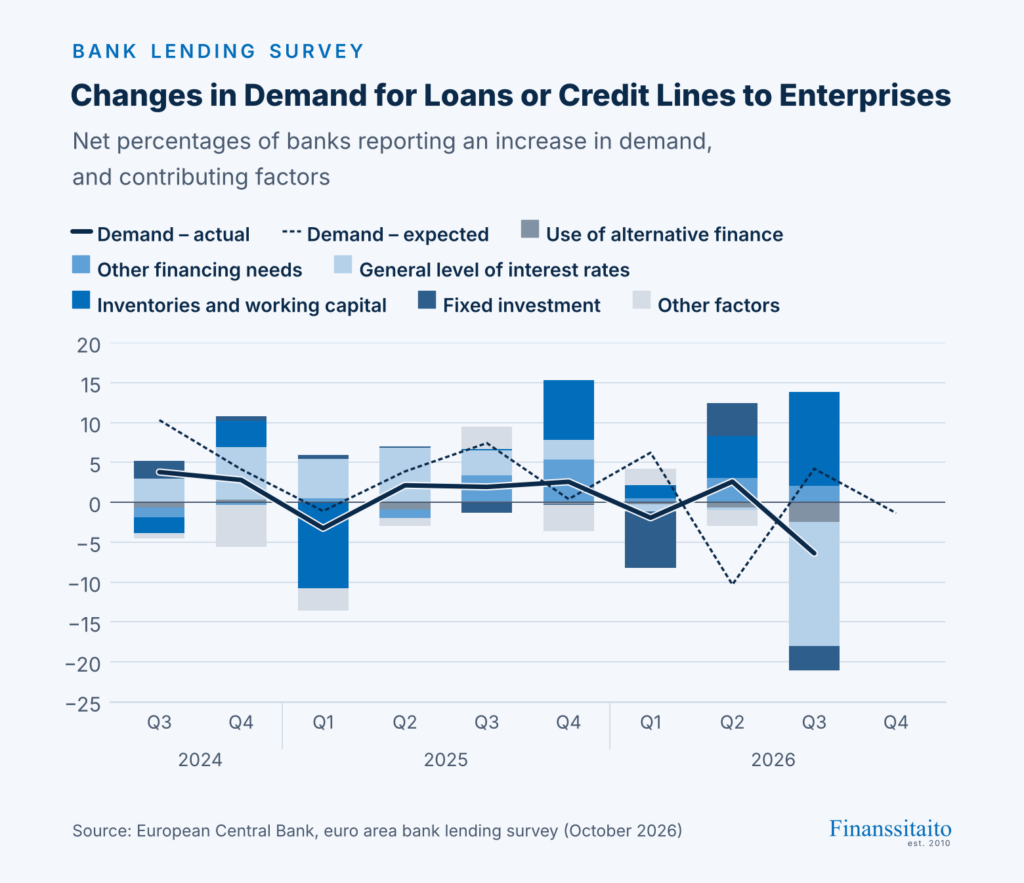
October 2026 euro area bank lending survey | European Central Bank
3. Confederation of Finnish Industries: Business Tendency Survey – October 2026
There were no major changes in Finnish companies’ business cycles in recent months. The situation is still weaker than average, but has clearly recovered since the beginning of the year. Output grew fairly widely, most strongly in industry. The total number of personnel no longer decreased, and profitability turned slightly better. The business cycle in industry has continued on a clear upward trend. Output is growing, profitability is improving and now the number of personnel has also turned to growth. Although demand is still weak for many companies, capacity shortages have become more common alongside labour shortages.
Business cycle assessments in construction fell slightly short of the readings of the previous survey, but the recovery since the beginning of the year has been clear. Output has grown and companies have started to add personnel. Expectations for the coming months remained confident. Business cycle development among service companies has been more subdued than in other sectors, but sales have grown moderately. Steady growth is forecast to continue.
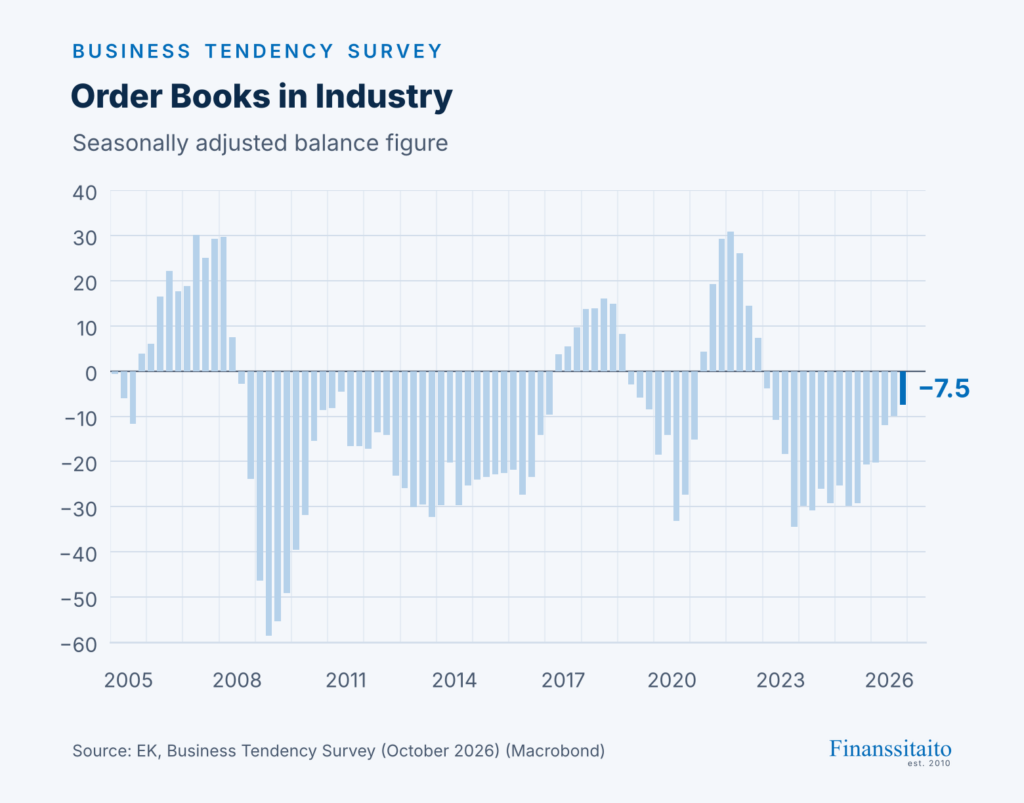
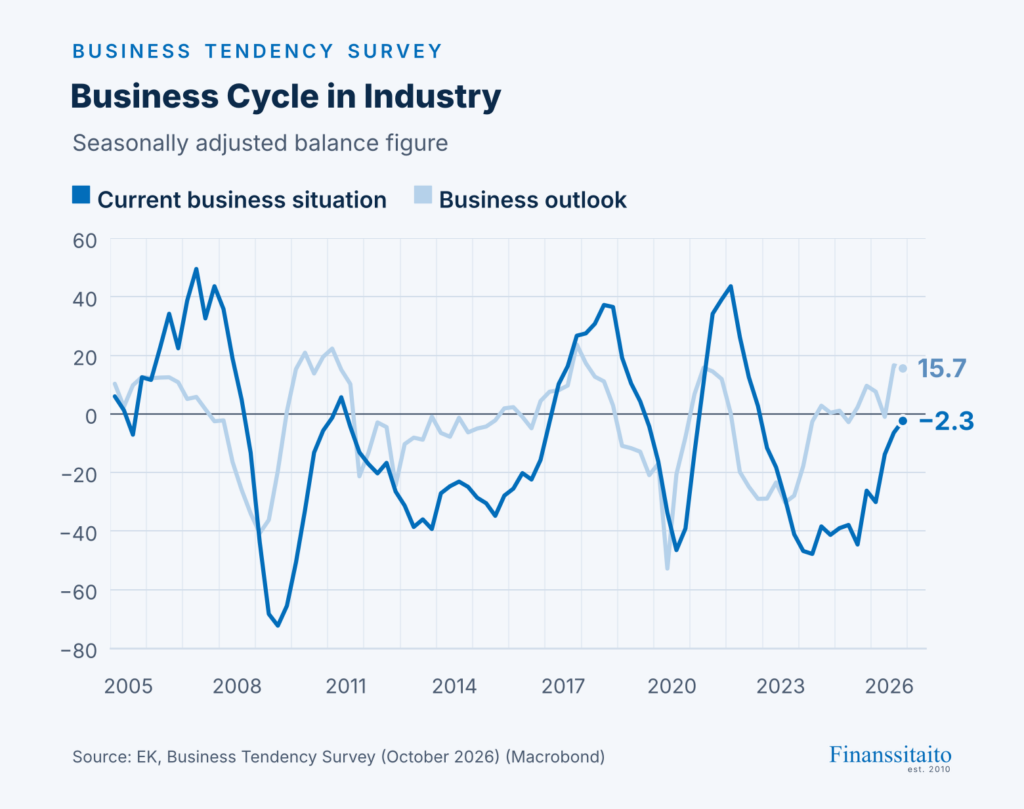
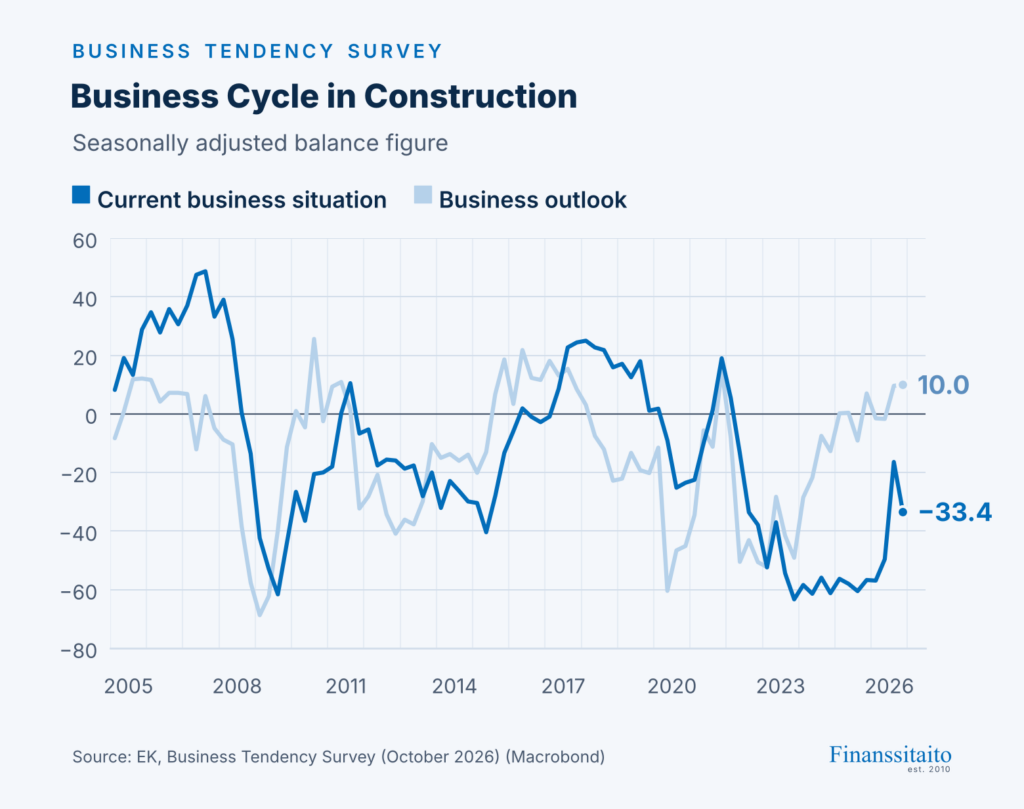
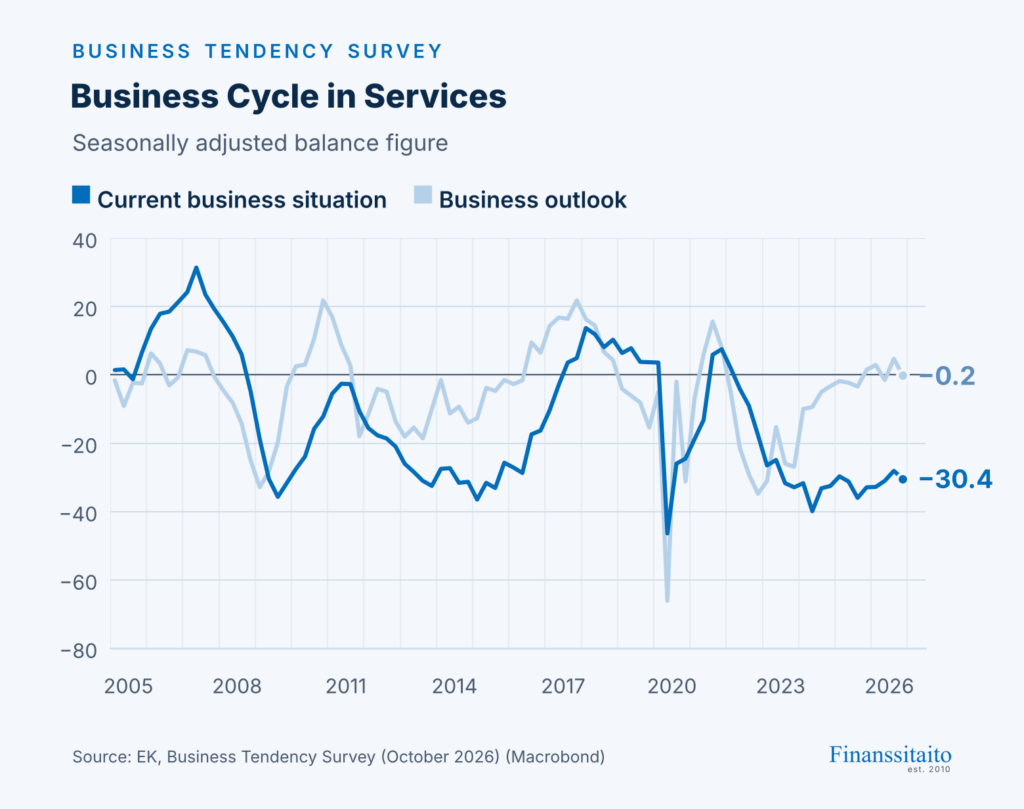
Translated from Finnish
Suhdannebarometri – lokakuu 2026 | Elinkeinoelämän keskusliitto
4. Confederation of Finnish Industries: Confidence Indicators Declined Somewhat – Level Remains Moderately Good
Business confidence in Finland weakened slightly in October. Confidence in manufacturing and construction saw only minor changes, while the confidence indicators for services and retail trade declined somewhat.
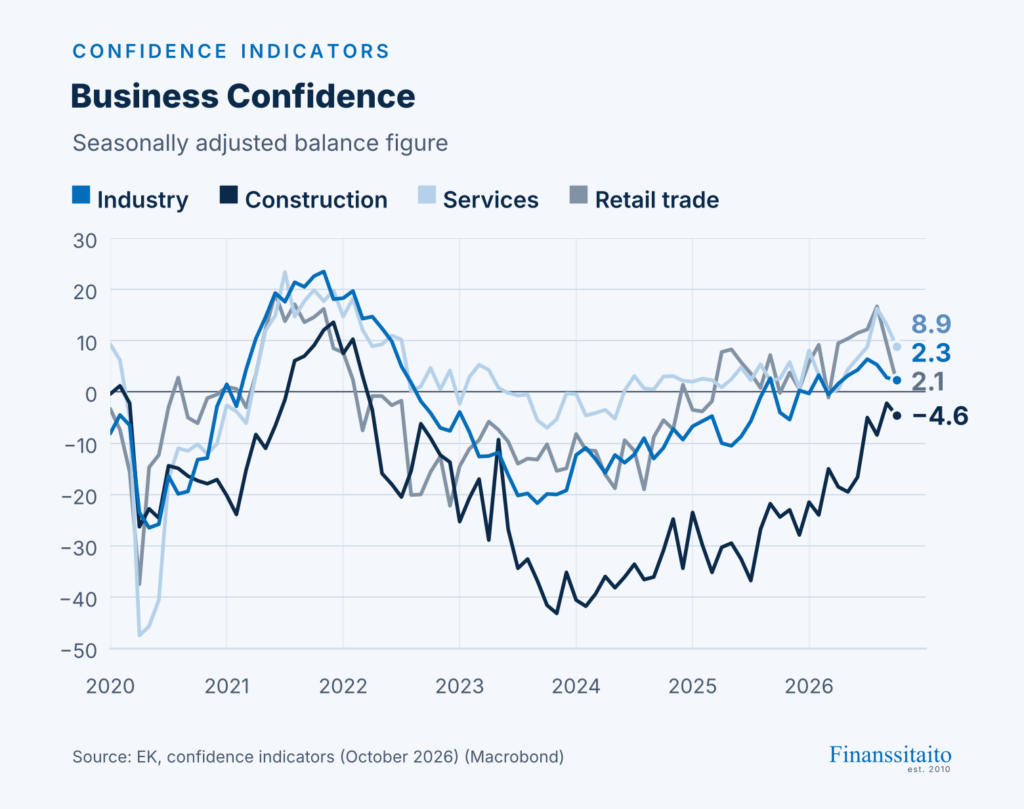
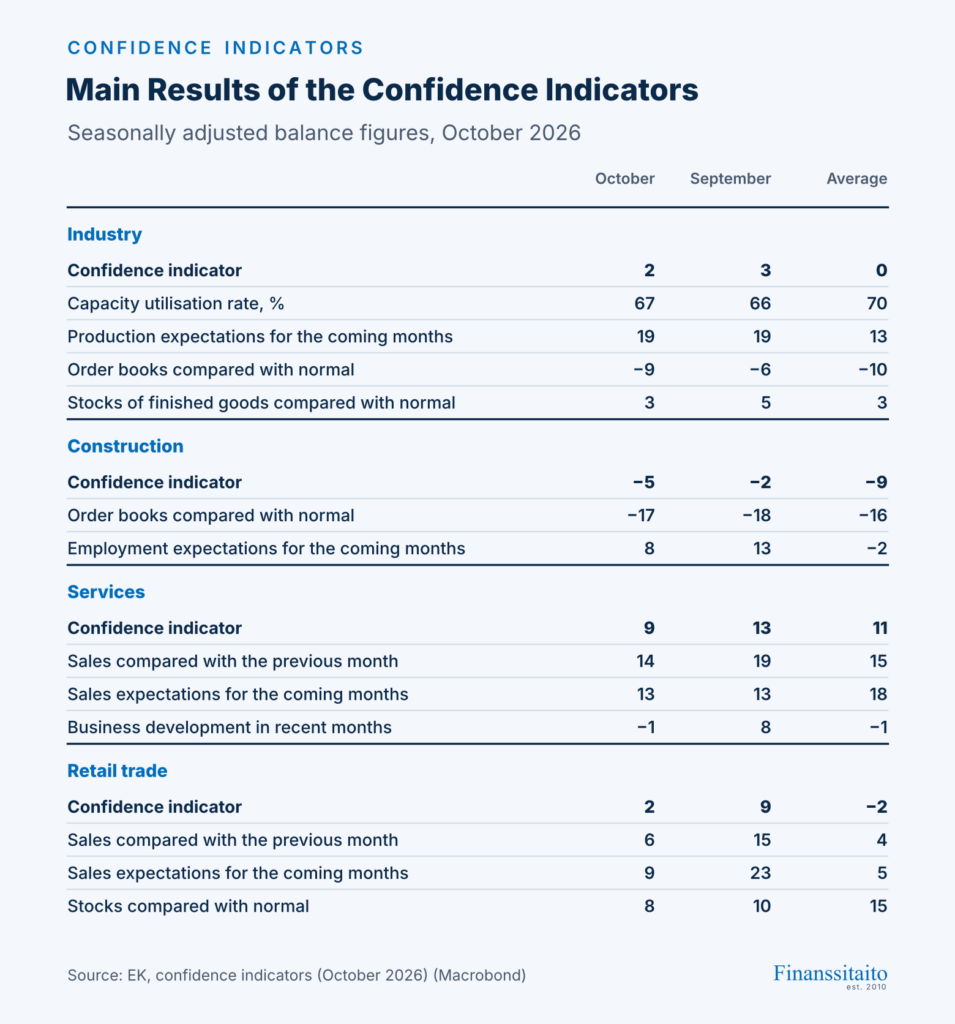
Confidence indicators declined somewhat – level remains moderately good | Confederation of Finnish Industries
5. Federation of Finnish Enterprises: Entrepreneur Gallup: Economic Situation and Outlook
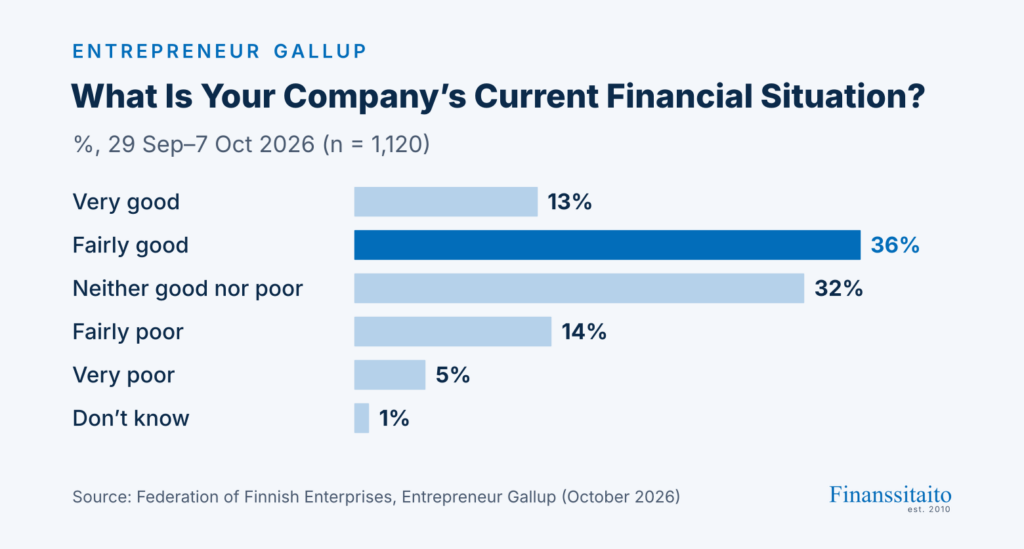
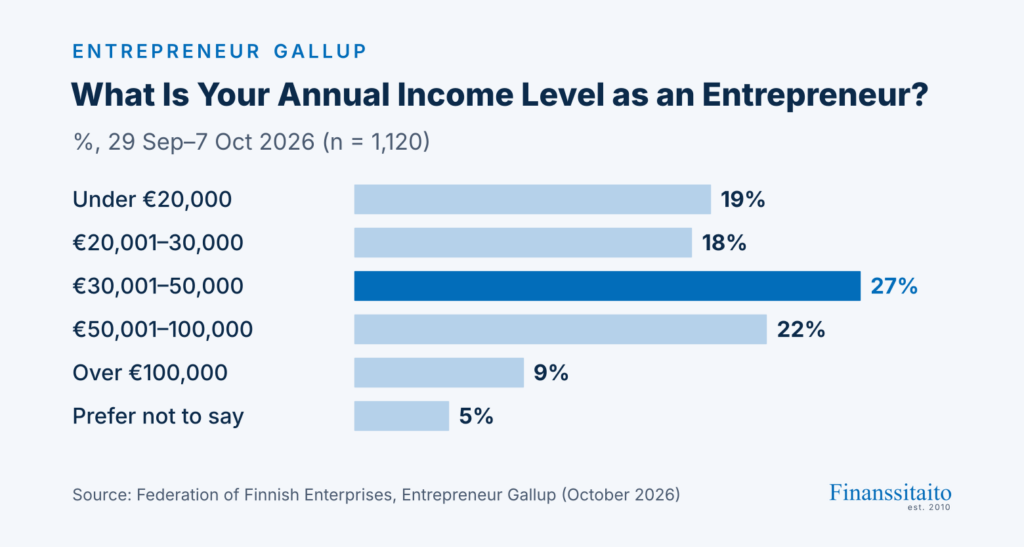
Translated from Finnish
Yrittäjägallupit 2026 | Suomen Yrittäjät ry
6. Ilmarinen’s Business Cycle Index: When Will Growth in the IT and Communications Sector Turn into Jobs?
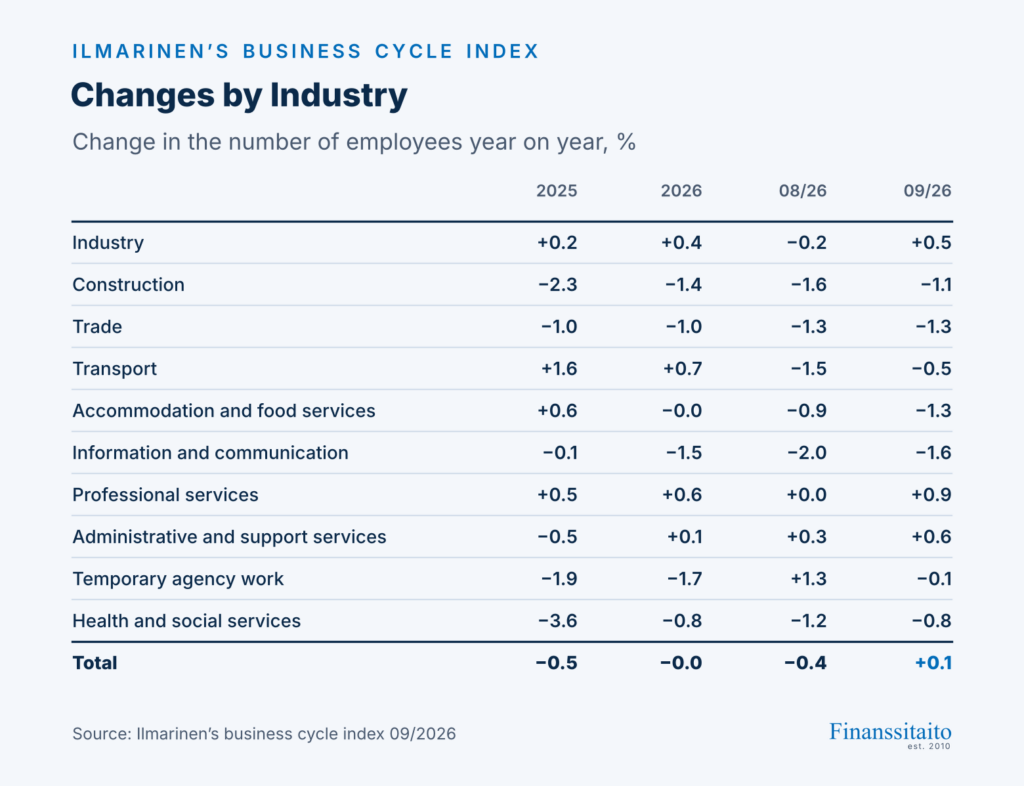
The number of employees grew by 0.1% in September compared with a year earlier in the companies included in Ilmarinen’s business cycle index. In the information and communication sector, however, the number of employees fell by 1.6%. The sector’s turnover and output have strengthened, but the growth is not yet reflected in the number of employees.
Growth was seen in professional services (+0.9%), administrative and support services (+0.6%) and industry (+0.5%). The number of employees fell in information and communication (−1.6%), accommodation and food services (−1.3%), trade (−1.3%), construction (−1.1%), health and social services (−0.8%), transport (−0.5%) and temporary agency work (−0.1%).
Translated from Finnish
Ilmarisen suhdanneindeksi: Milloin IT- ja viestintäalan kasvu muuttuu työpaikoiksi? | Keskinäinen Eläkevakuutusyhtiö Ilmarinen
7. Intrum: Intrum Insight Q3/2026
During the third quarter, the number of consumer collection cases increased slightly and their capital remained at the same level as in the previous quarter. The downward trend in both the number and the capital of business collection cases continued compared with the previous quarter. Based on collection success rates, the upward trend in the payment ability of both consumers and companies seen earlier in the year continued in Q3. The research data included 339,532 companies, of which 17,609 had payment delays.
According to Intrum, both the number and the capital of business collection cases continued to decline in the third quarter. The index describing the number of receivables fell from about 121 to 117 and the capital index from about 105 to 103 (2022 quarterly average = 100). Companies’ payment ability continued to strengthen. The index describing the three-month collection success rate rose to about 100 in the second quarter of 2026, i.e. to the 2022 average level. In the second quarter of 2025, the index stood at about 79.
Translated from Finnish
Intrum Insight Q3/2026 | Intrum Oy
8. EY: Transaction Trends Q3 2026
In the third quarter of 2026, 170 M&A transactions were announced in Finland, about 14% more than in the corresponding period of 2025. The positive development of the Finnish M&A market continued despite the quieter summer months. The deal count for the last 12 months rose to 751 transactions, the highest level in the entire review period, laying the foundation for a record year.
Industrials was the most active sector of the quarter with 40 deals, followed by real estate, hospitality and construction with 38 deals and technology, media and telecommunications with 37 deals. The share of private equity investors in all transactions of the quarter fell to 27%, below both the last-12-month level (32%) and the three-year moving average (31%).
Translated from Finnish
Transaction Trends Q3 2026 | EY-Parthenon Suomi
9. Finnish Customs: Monthly Statistics on International Trade in Goods: Export Volume Up 9.5% and Import Volume Up 6.9% in August
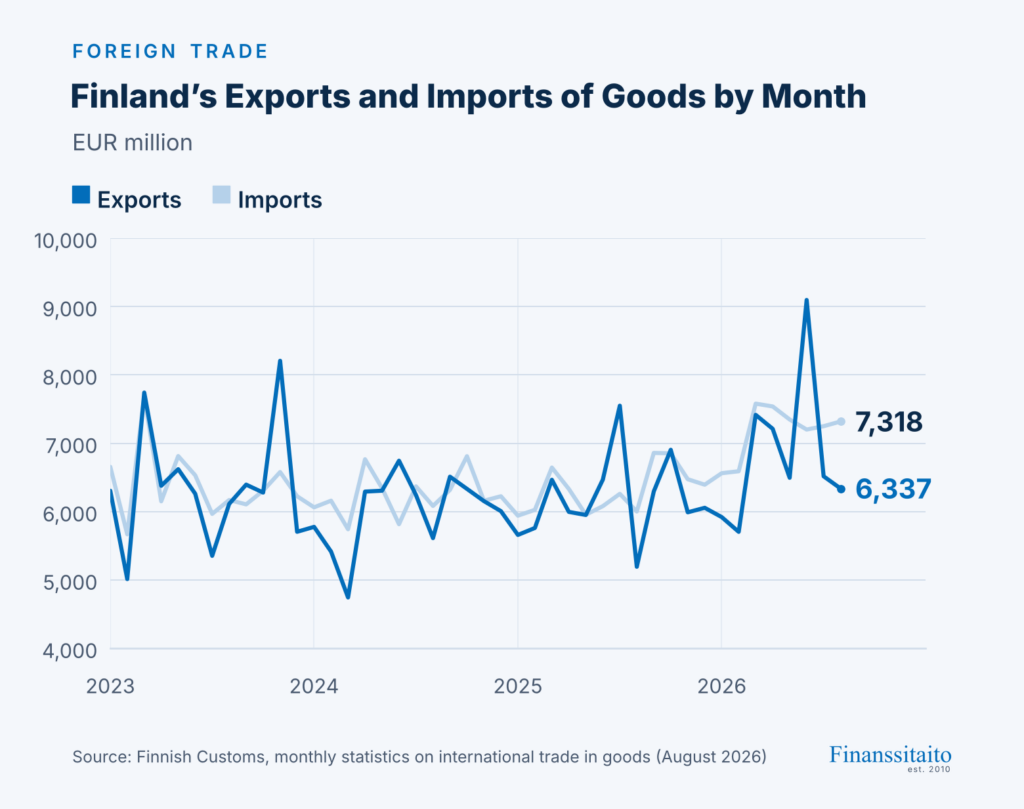
The value of Finnish exports of goods increased by 22.1 per cent year-on-year in August, according to the international trade in goods statistics provided by Finnish Customs. The value of Finnish exports was EUR 6.3 billion. Export volume increased by 9.5 per cent and export prices rose by 11.5 per cent year-on-year. The value of imports increased by 22.0 per cent in August to EUR 7.3 billion. Import prices increased by 13.5 per cent and import volume by 6.9 per cent compared to August 2025.
In August 2026, the trade balance showed a deficit of EUR 981 million. The terms of trade declined in August compared to the corresponding month of 2025 as import prices rose more than export prices.
The value of exports of capital goods grew by 11.9 per cent in August. The value of exports of industrial supplies grew by 22.2 per cent year-on-year.
Monthly statistics on the international trade in goods, August 2026 | Finnish Customs
10. Finance Finland’s Fund Report: Rising Interest Rates and Uncertainty Prompted Investors to Sell Long-Term Bond Funds – Money Flowed into Short-Term Bond Funds and Equity Funds
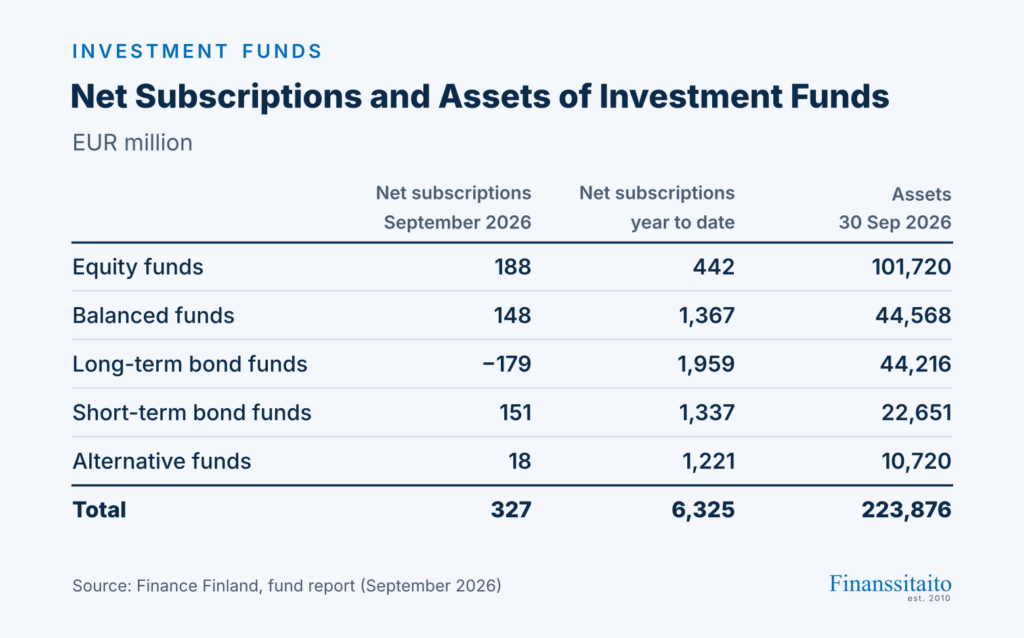
Movements in the interest rate markets were also reflected in investment funds. Net subscriptions to long-term bond funds were negative in September, reflecting the rise in interest rates. Among equity funds, emerging markets gained in popularity. Redemptions from Finland funds accelerated as investors took profits. Fund assets fell slightly from August’s record level, even though investments in funds exceeded redemptions. The decline was due to market developments in September.
Assets in Finnish investment funds fell by EUR 2.6 billion to EUR 223.9 billion in September. Net subscriptions amounted to EUR 327 million, so the decline in assets was due to falling fund values. For the year as a whole, net subscriptions totalled EUR 6.3 billion by the end of September, of which September’s subscriptions accounted for 5%.
Translated from Finnish
Nousevat korot ja epävarmuus saivat sijoittajat myymään pitkän koron rahastoja – raha virtasi lyhyen koron rahastoihin ja osakerahastoihin | Finanssiala ry
11. Fingrid: State of the Power System (October)
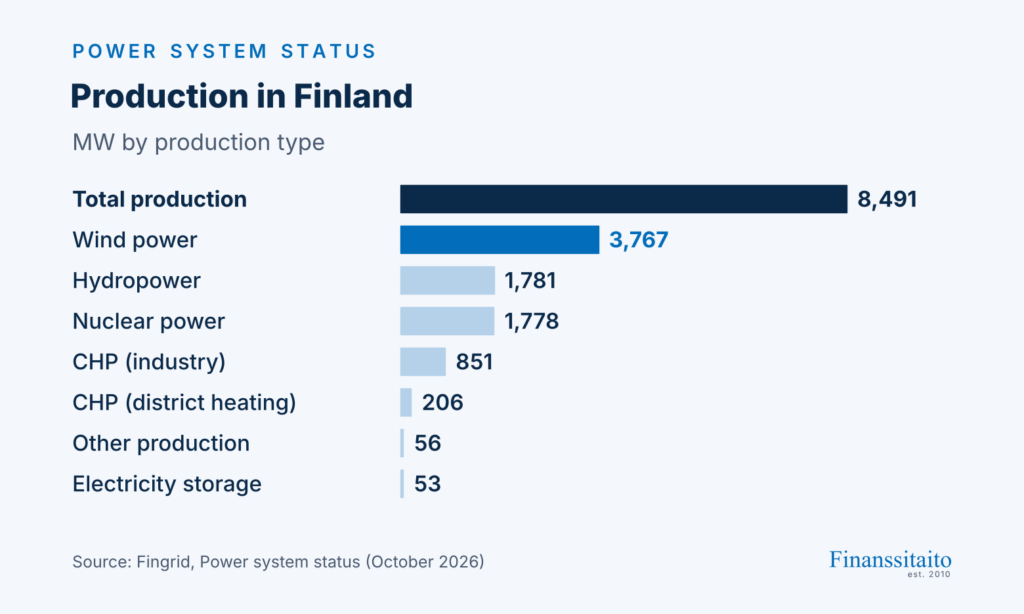
Production: 8,491 MW
Consumption: 9,749 MW
Finland’s area price on the day-ahead market: €22.71/MWh
State of the power system | Fingrid
12. Eurostat: Household Electricity Prices Ease in 1st Half of 2026
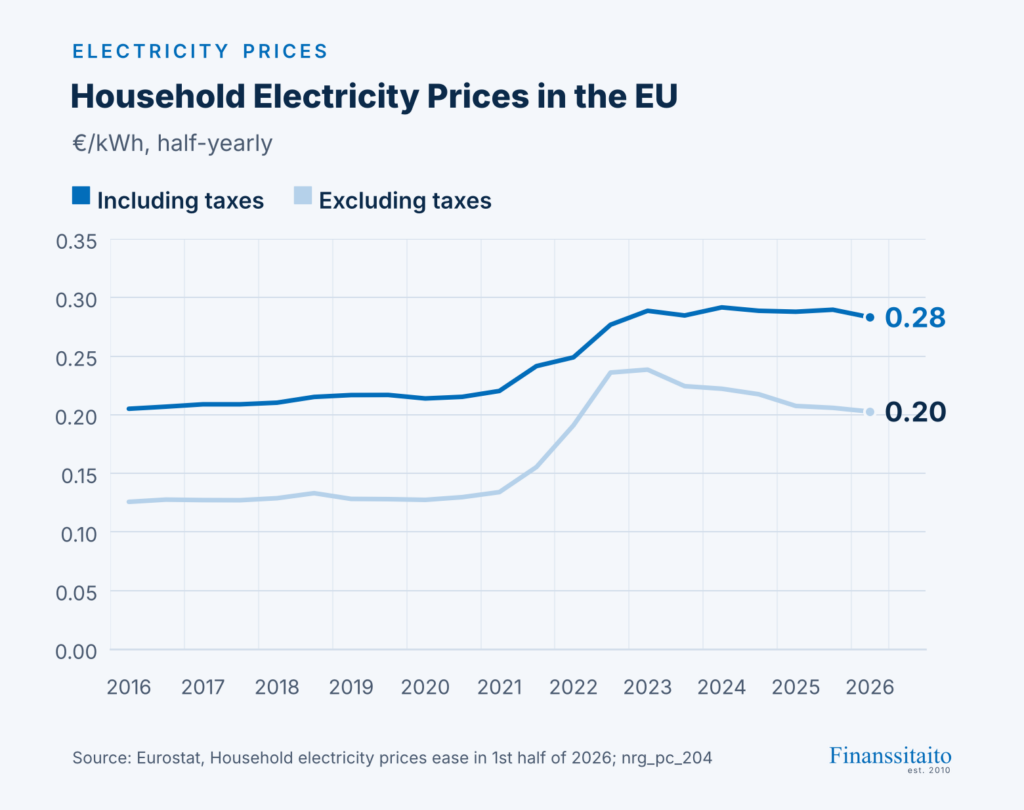
In the first half of 2026, average electricity prices for households in the EU decreased by 2.2% to €0.28, down from €0.29 per kWh in the second half of 2025. Prices remained well above levels from before the 2022 energy crisis.
Considerable variations in household electricity prices were observed among EU countries; 6 countries reported prices above €0.30 per kWh, while 5 countries recorded prices below €0.20 per kWh. Ireland reported the highest electricity prices at €0.39 per kWh, followed by Germany and Belgium. By contrast, the lowest prices were observed in Hungary (€0.11).
Household electricity prices ease in 1st half of 2026 | Eurostat
13. Statistics Finland: Output of the National Economy Grew in September 2026
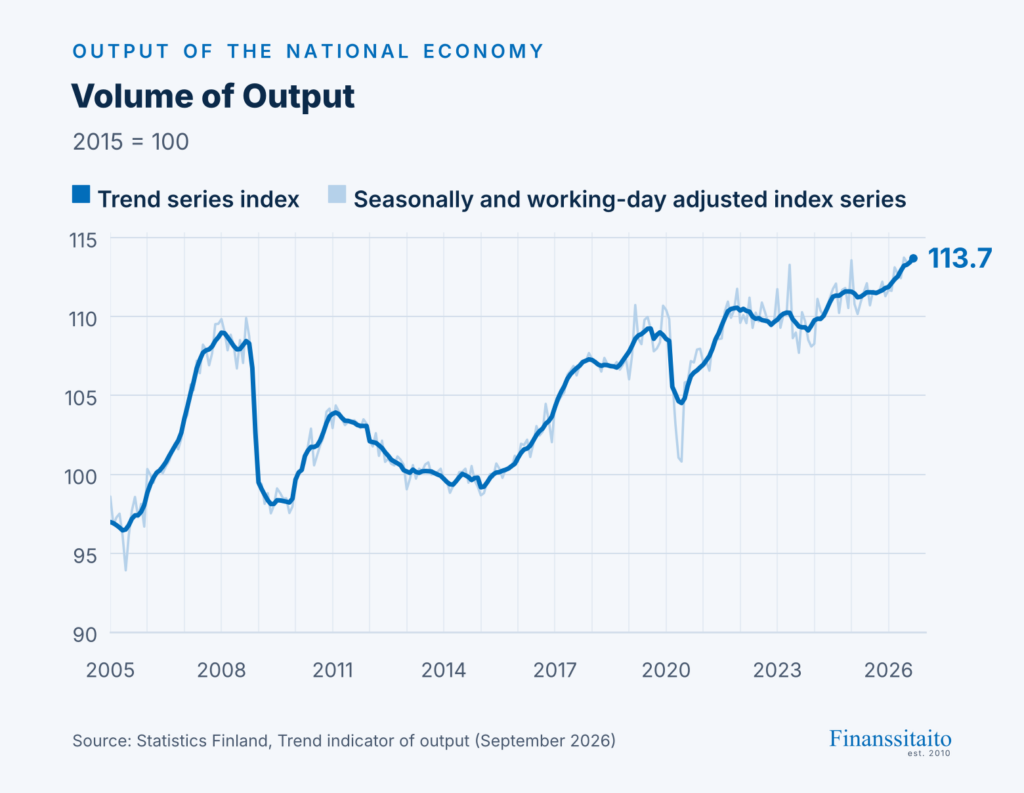
According to Statistics Finland, output adjusted for working days grew by 2.0 per cent in September 2026 from September one year before. Seasonally adjusted output increased by 0.2 per cent in September from the month before. According to revised data, working day adjusted output grew in August by 1.3 per cent (previously 2.3%) from August one year before.
Output of the national economy grew in September 2026 | Statistics Finland
14. Statistics Finland: Consumer Confidence
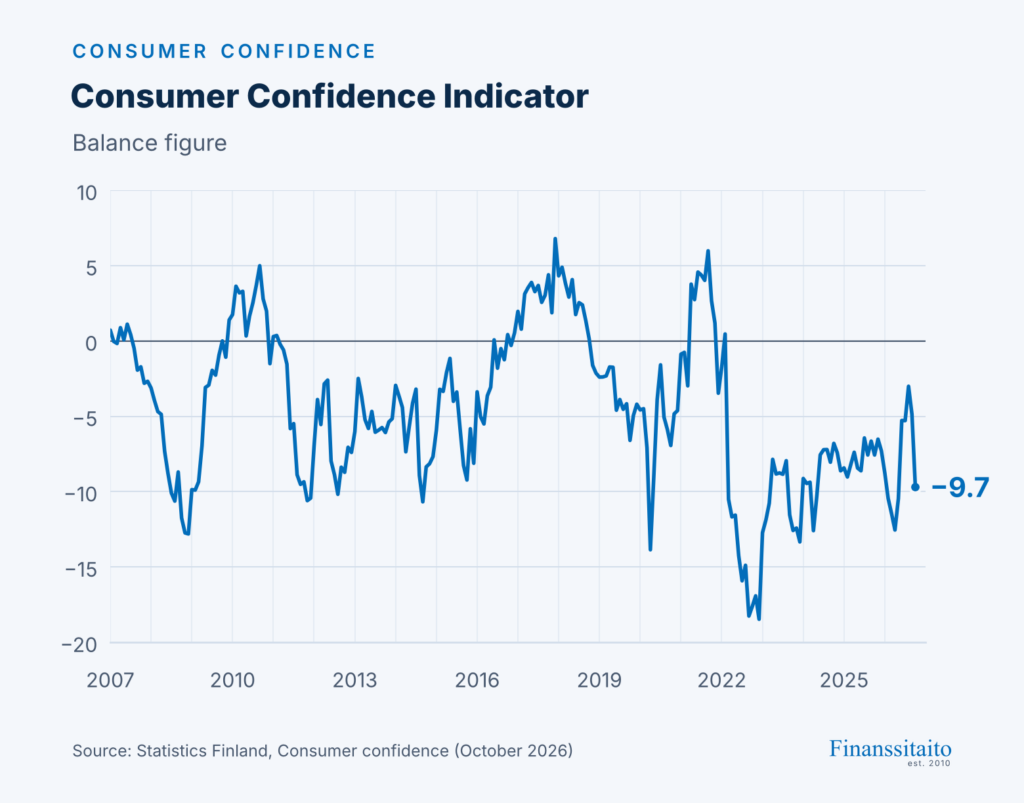
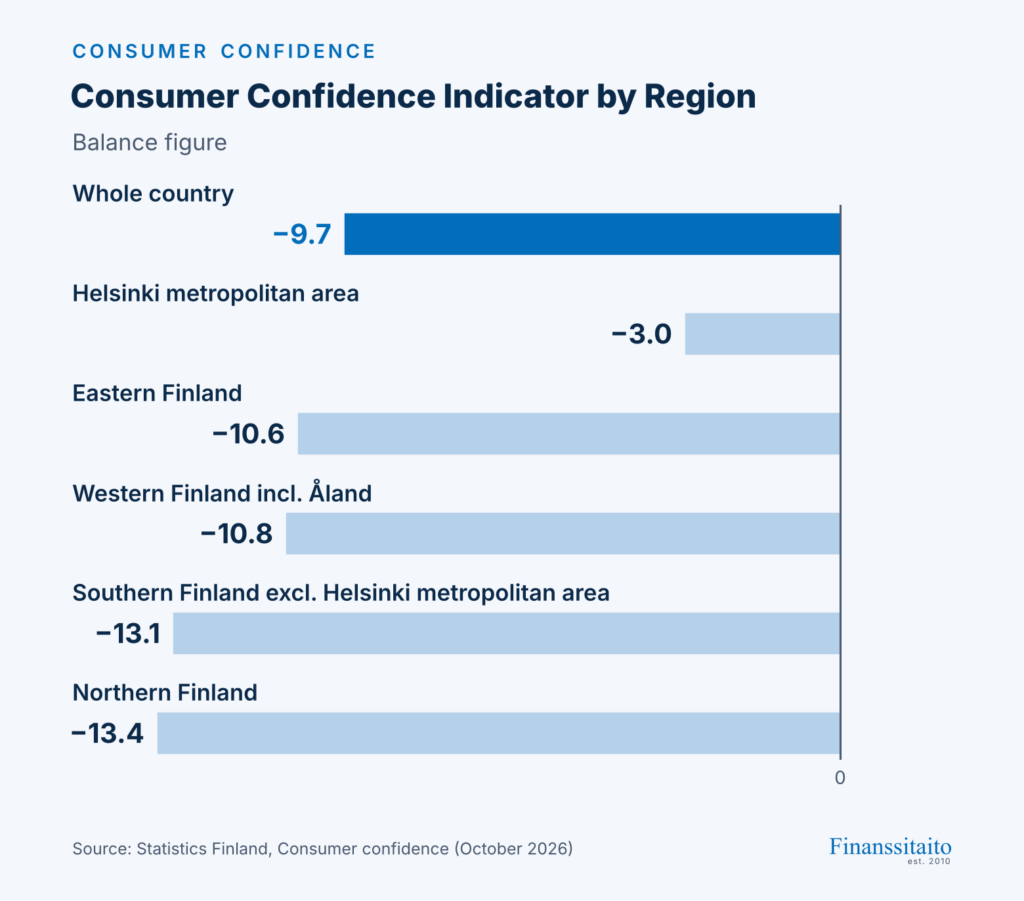
The statistics on consumer confidence describe consumers’ views and expectations concerning their own and Finland’s economy and consumers’ intentions of making purchases, saving and raising a loan.
Consumer confidence indicator in October: −9.7
Consumer confidence | Statistics Finland
15. Statistics Finland: Bankruptcies and Business Restructuring Proceedings
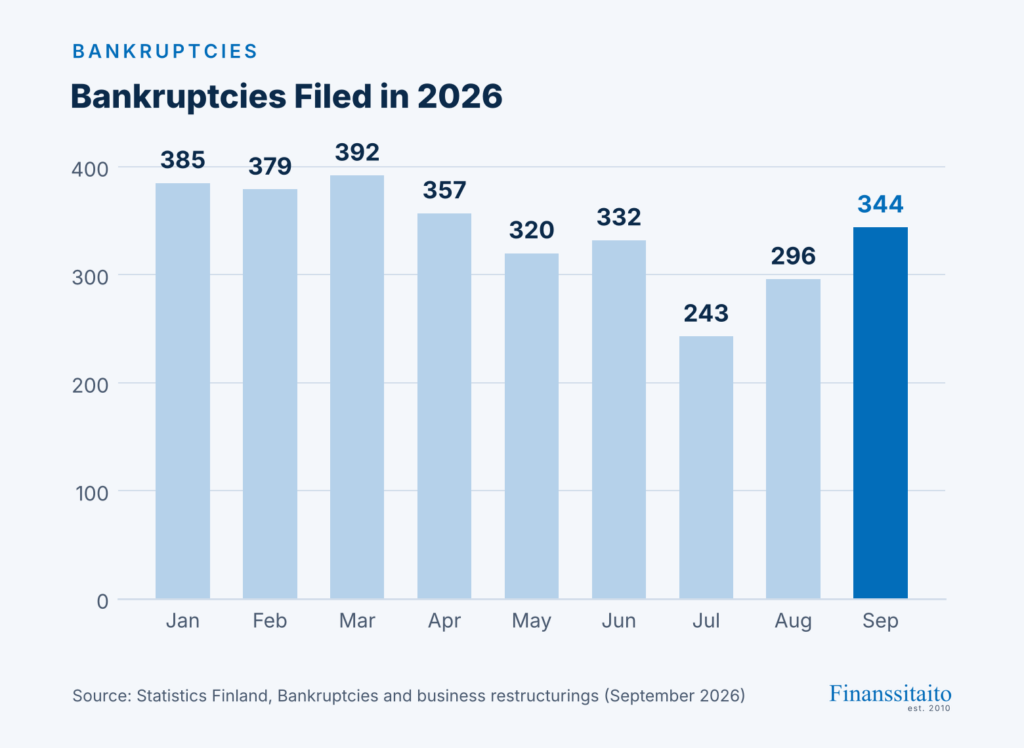
The Statistics on bankruptcies and business restructuring proceedings statistics describe the bankruptcy cases instigated and decided by district courts.
Bankruptcies instigated:
in September: 344
Bankruptcies and business restructuring proceedings | Statistics Finland
16. Statistics Finland: Turnover of Trade
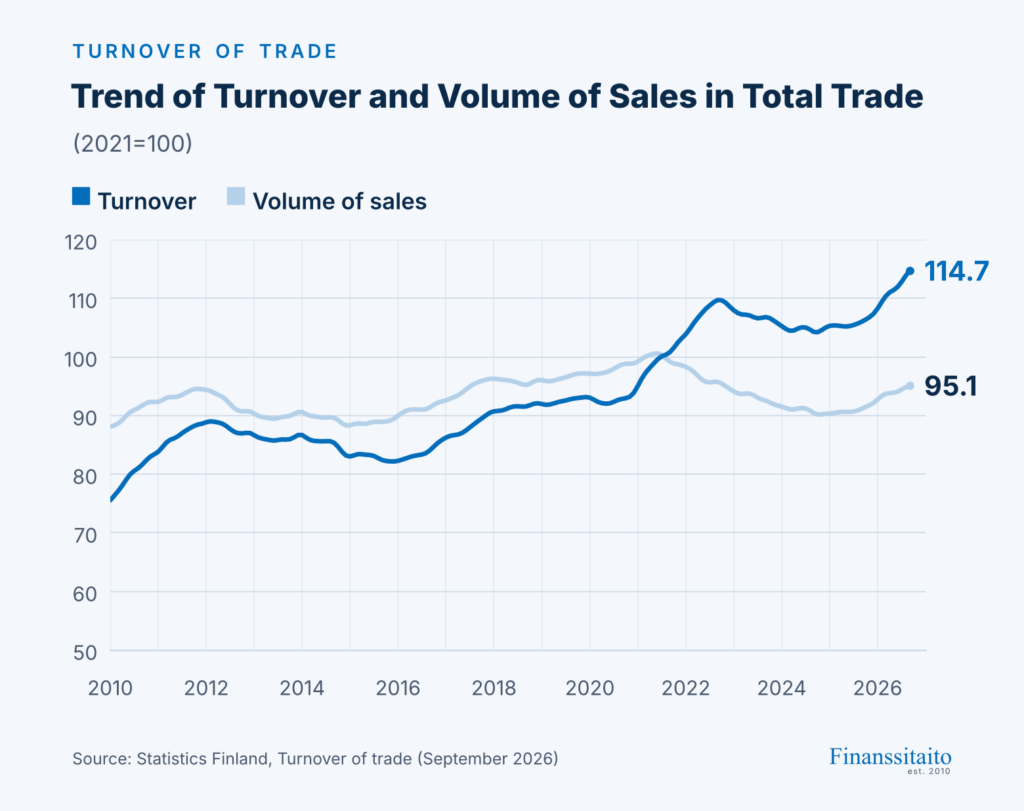
The index of turnover of trade describes development in turnover of enterprises engaged in trade. Turnover is exclusive of value-added tax. In addition, the volume index of sales, from which the impact of prices has been eliminated, is produced on trade.
Annual change in working-day adjusted turnover in September: 8.9%
Annual change in working-day adjusted volume of sales in September: 4.8%
Change in the seasonally adjusted index series from the previous month in September: 1.1%
Turnover of trade | Statistics Finland
17. Statistics Finland: Turnover in Construction Grew by 13.4 Per Cent in August 2026 from One Year Ago
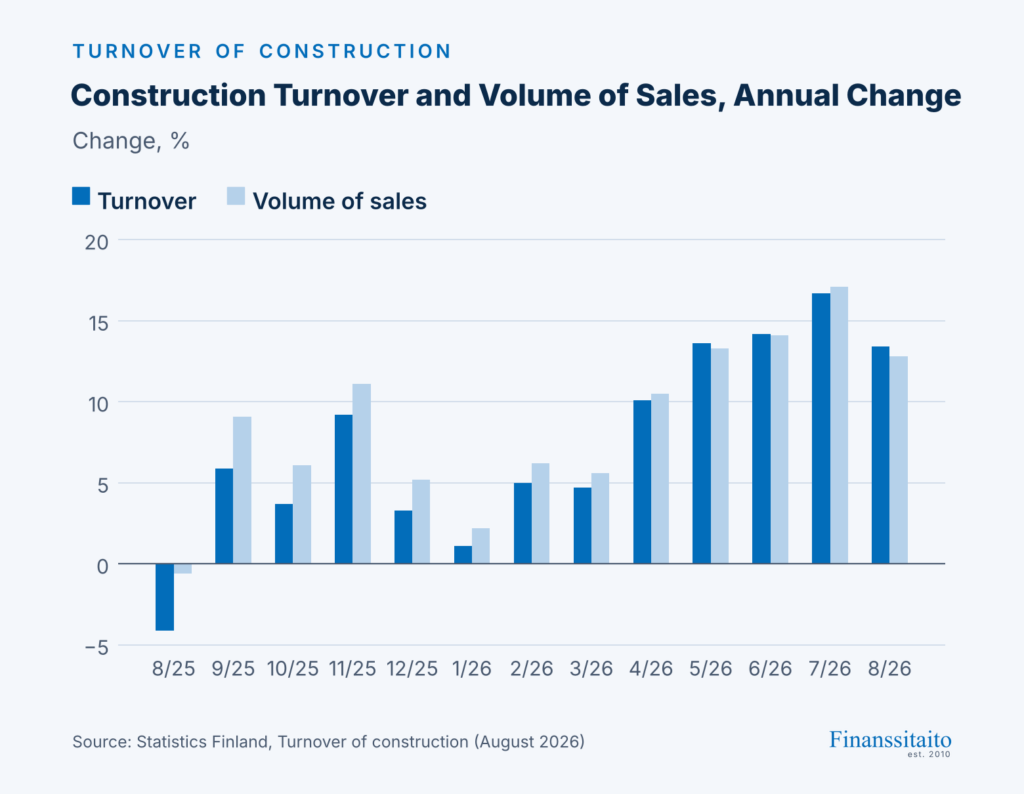
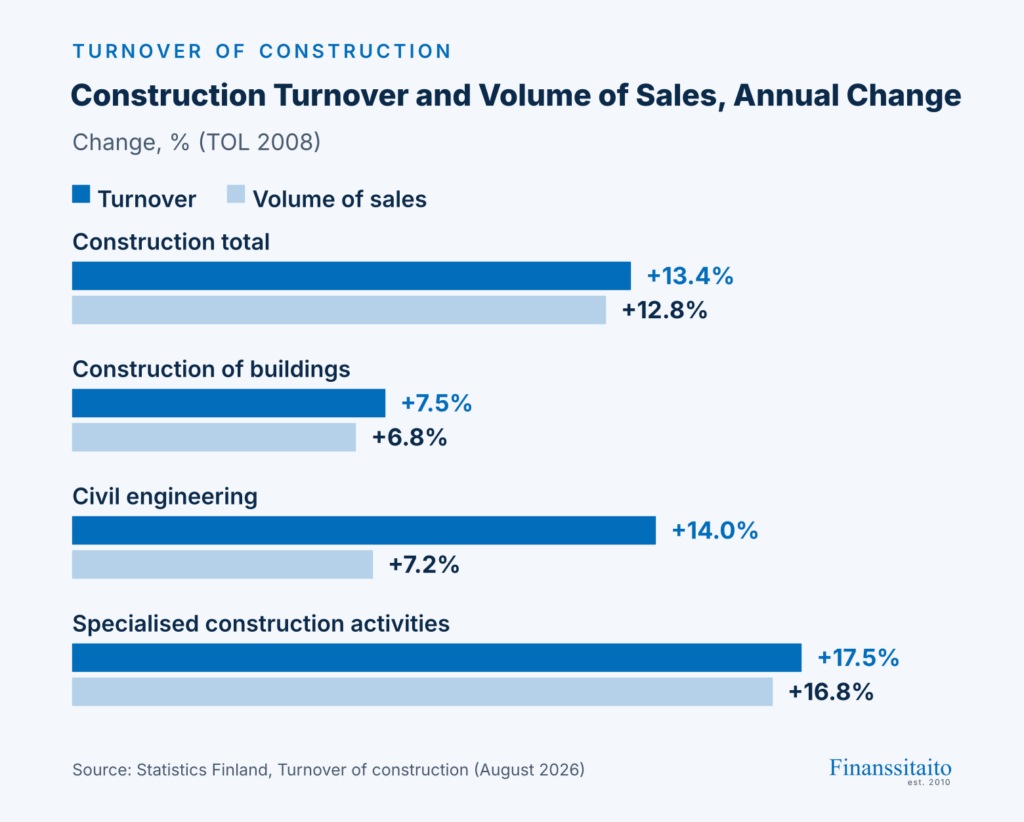
According to Statistics Finland, the working day adjusted turnover of construction enterprises increased by 13.4 per cent in August 2026 compared to the previous year. The volume of sales, from which the impact of price changes has been eliminated, increased by 12.8 per cent.
Working day adjusted turnover in building construction grew by 7.5 per cent and sales volume by 6.8 per cent in August 2026 compared to one year before. Working day adjusted turnover in civil engineering increased by 14.0 per cent and sales volume increased by 7.2 per cent from the previous year. Turnover in specialised construction activities grew by 17.5 per cent and sales volume by 16.8 per cent from one year earlier.
Turnover in construction grew by 13.4 per cent in August 2026 from one year ago | Statistics Finland
18. Statistics Finland: Building Stock and New Production
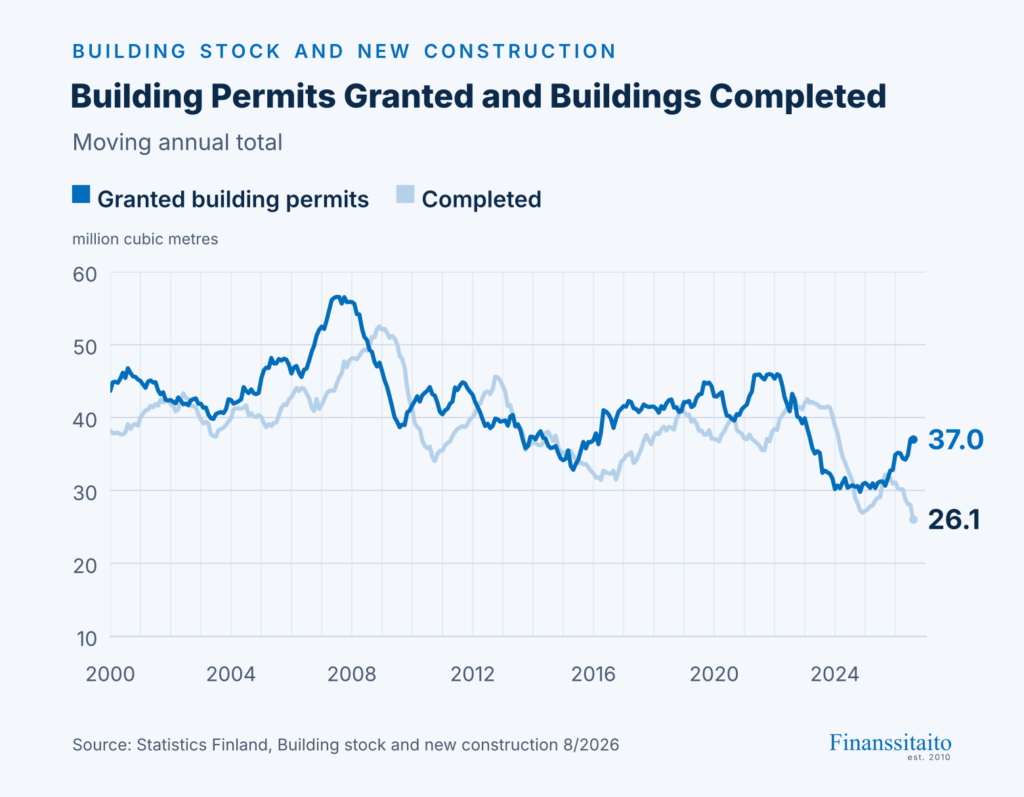
The statistics on building stock and new production describe the existing building stock, the volume of newbuilding subject to building permits and the volume index of newbuilding.
Granted building permits, moving annual total in August: 37,020,299 cubic metres
Annual change in the volume of new construction in August: −1.4%
Building stock and new production | Statistics Finland
19. Statistics Finland: Building Cost Index
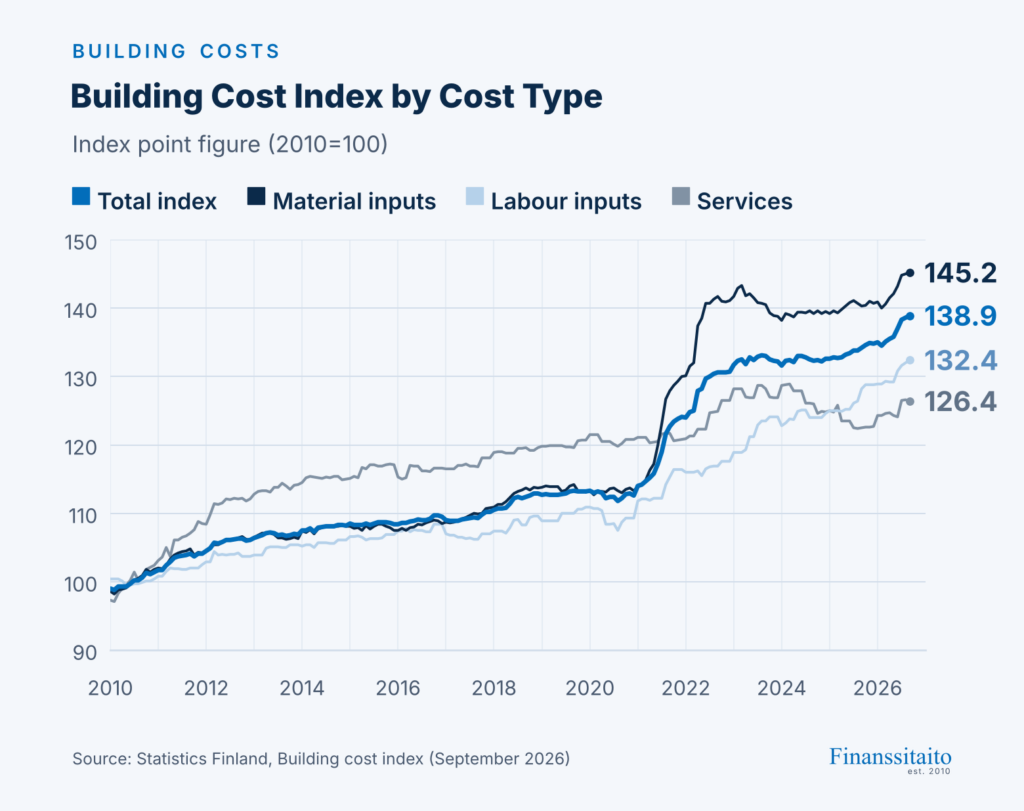
The building cost index describes relative changes in building costs and construction works of buildings of essentially similar properties using the price development of basic inputs used in building.
Annual change in the building cost index in September: 3.4%
Heating, plumbing and sewerage: 11.6%
Concrete, bricks and blocks: 7.2%
Roofing: 5.7%
Electricity, control, lighting and lifts: 5.1%
Building cost index | Statistics Finland
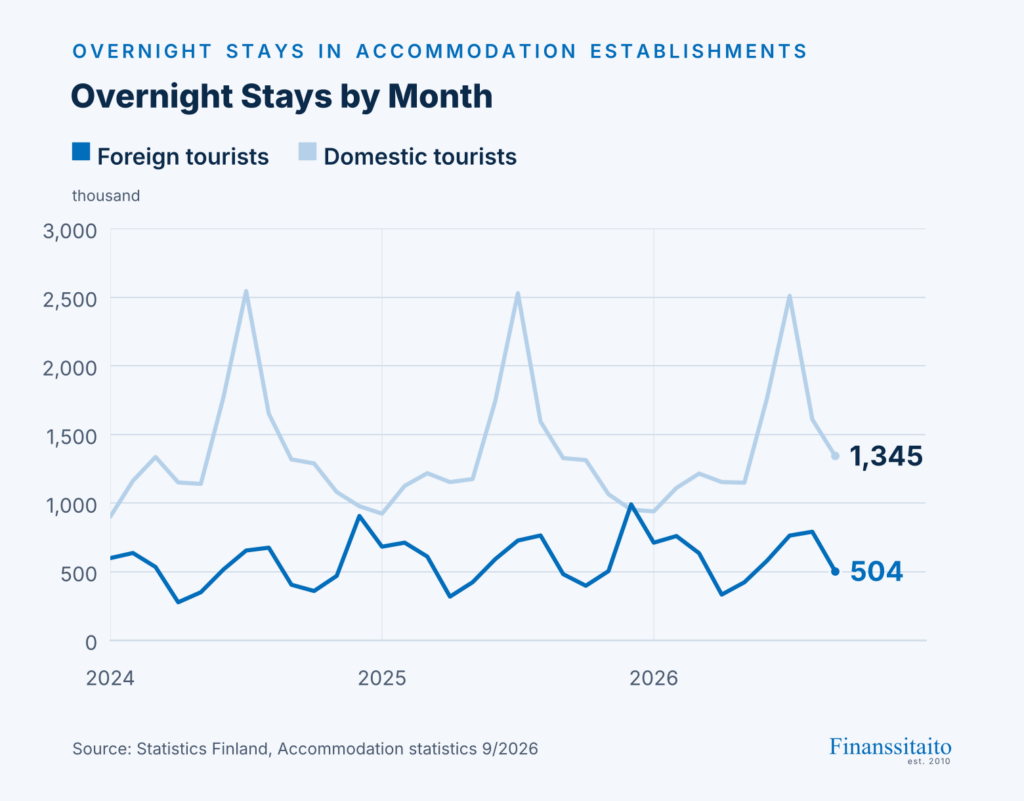
20. Statistics Finland: Nights Spent by Foreign Tourists in Finland Grew by 5 Per Cent from the Previous Year in September 2026
According to Statistics Finland’s preliminary data, 1.85 million overnight stays were recorded at accommodation establishments in September 2026. The number of nights spent by resident tourists was 1.34 million and that of nights spent by non-resident tourists 0.50 million. The total number of overnight stays increased by two per cent from the year before.
The number of nights spent by non-resident tourists at accommodation establishments increased by 5 per cent from the year before. The highest numbers of foreign visitors came from Germany, the United States and Sweden. The occupancy rate of hotel rooms was 61 per cent, which is three percentage points higher than in September 2025. The average price of a hotel room was EUR 121, which is EUR two more than in the previous year. The average price of a hotel room was highest in Pirkanmaa, EUR 132.